I am going to start this article by providing you with a chart I created from data about school disciplinary disparities of a certain demographic in Minnesota public schools (group identities removed), and then ask you to think about what inferences you can appropriately draw and take action on:
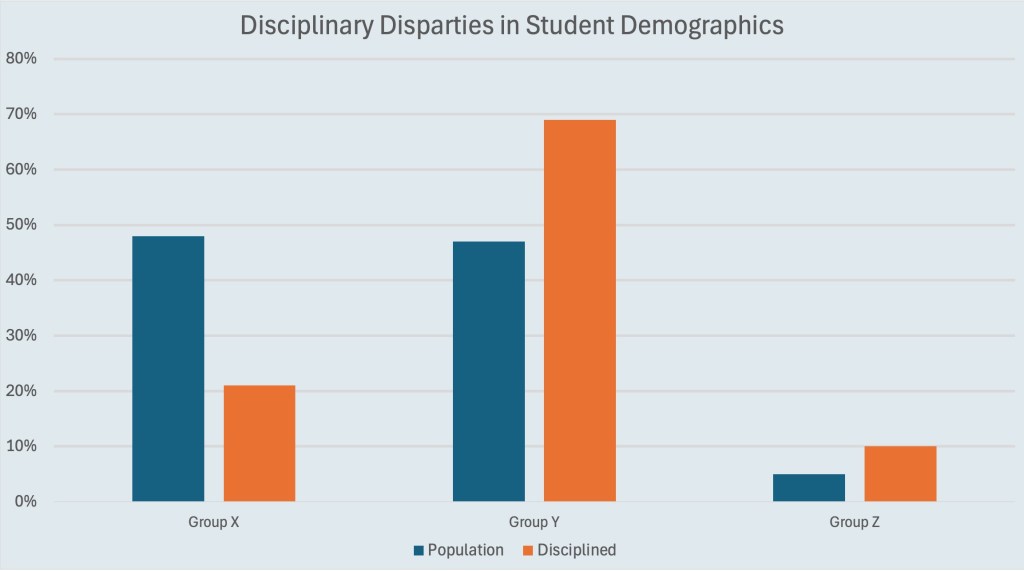
Population = percentage of students in the group compared to total enrollment
Discipline = percentage of students in the group subjected to disciplinary measures
Are these numbers actionable? Can we determine how to interrupt and end disparities in student demographics based on charts like this? What else do you need to know? Personally, I’d like us to apply scientific principles to develop falsifiable hypothesis and test the hypotheses through statistical analysis and, where appropriate and ethical, random controlled testing.
What if, before you make your decision on how to respond to these data, I told you that there is a deep well of scientific literature exploring historical, long term norms and prejudices that impact how all three groups are treated differently in American culture and society? What conclusions are would you be ready to make?
According to the Minnesota Department of Human Rights (MDHR), the Minnesota Department of Education (MDE), Education Minnesota, and the Hopkins 270 district administration and School Board, the disparities demonstrated by similar data released by MDHR constitute valid, conclusive evidence of systematic inherent bias and historical prejudices against Groups Y and Z.
Educated professionals have referred to data charts published by MDHR showing similar disciplinary disparities as “horrific” and stating that legislators should be “ashamed” by the data — no need to develop alternative hypotheses, no other statistical analysis required that might falsify any hypothesis, and certainly no experimental random controlled testing needed.
Moreover, MDHR, MDE, Education Minnesota and Hopkins 270 district administration all agree: talking about equality in identifying and removing disparities is unacceptable, and these data demonstrate unequivocally that Group Y and Group Z are being harmed by implicit biases, and that remedial measures that implement equity must be immediately implemented.
Does the Above Chart Demonstrate Inherent Bias?
No. The above chart does not demonstrate anything beyond the existence of a negative correlation between student population percentages broken down into three groups and the disproportionate percentages of disciplinary measures implemented across all three students groups.
What may demonstrate inherent bias is an individual’s emotional response to seeing the disparities between groups and deriving a conclusion that is unsupported by evidence that supports any one potential hypothesis over another.
So what is the above chart actually showing? Gender disparities in all forms of discipline in Minnesota public schools. In the chart above: X = students assigned at birth and identifying as female (girl), Y = students assigned at birth and identifying as male (boy), and Z = students identifying as transgender, non-binary, or other gender-expansive. 1
For shorthand purposes I’ll say it this way: life experience has shown that we expect biological boys will be more likely than biological girls to have disciplinary problems that result in suspension or expulsion, and few would feel even the slightest bit of embarrassment or discomfort in saying that. The fact that we haven’t done something to solve that problem is reflected in the often-repeated mantra: “boys will be boys.” But if we change gender to race — well then, many people are going to have a very different emotional response based on their life experiences, political views, and inherent biases.
MDHR 2018 Agreements
In 2018 Minnesota Department of Human Rights (MDHR) entered into agreements with 41 school districts and charter schools after identifying a pattern of “disparities in suspensions and expulsions for … students of color for non-safety related incidents.” [Source].2 Hopkins 270 was one of the 41. The identified racial disparities in suspensions and expulsions were demonstrated by showing the percentages of enrolled students of color vs. white students in Minnesota and the percentages of discipline imposed on students of color vs. white students for subjective behavior, as shown below from a 2022 Suspensions and Expulsions Report.

I have significant issues with the MDHR 2022 Suspensions and Expulsions Report, but I will save that for a different post.
Emotional Responses Can Overwhelm Logic
I completely understand why people — highly educated adults — would look at the data in the graph published by MDHR and feel a strong emotional responses. That is what it was designed to do. As I previously addressed, humans have evolved to see patterns and respond through our fight or flight mechanism.
But instead of taking the time to determine the causal relationship resulting in the racial disparities, MDHR, MDE, and Hopkins 270 have rushed into action based on correlative data. This represents the inherent biases that exist in those who are on a mission to eradicate racial prejudice and its impacts in our schools and public systems. It also represents a prime example of confirmation bias: the evidence was sought out by people charged with enforcing human rights in Minnesota and showed readers what they expected to see, confirming and validating their existing views. No further inquiry required to achieve the intended and desired results.
Action in the Absence of Proven Causation
In response to such “horrific” disparities, agreements were made between MDHR and the other 40 school districts and charter schools showing similar numbers. Under these agreements, the districts and schools were required to:
- Develop an improvement plan.
- Track disaggregated data to demonstrate progress and continuous improvement.
- Submit progress reports and participate in quarterly meetings.
In addition, numerous recommendations were made by the State to the schools end disparities as demonstrated in the chart above, including to:
- “Reduce the use of school resource officers when making discipline decisions.”
- Prioritize “educator training that focuses on building capacities and skills such as social and emotional learning, positive behavior interventions ands upports, anti-bias education, and non-exclusionary discipline”.
- “Ensure professional development is reinforced with consistent coaching for educators,” including implicit bias training.
- Explore implementation of restorative practices in the schools.
ASIDE: What is Minnesota in general, and Hopkins 270 in particular, doing to remediate disciplinary disparities based on gender? The disparity numbers when comparing girls vs. boys is substantially similar to white students vs. students of color. Yet no one seems to care the slightest about this demographic set. Why?
Conclusion
A mission to eradicate racism is incredibly honorable and worth praise. While I do not doubt the overall best of intentions, what I see is people who have a hammer and have learned to use it. And to them, everything looks like a nail.
The mission of public schools in Minnesota, including Hopkins 270, is established by statute. It is to ensure individual academic achievement, an informed citizenry, and a highly productive work force. I believe we should be focused on removing the barriers to achieving that mission objective, such as finding ways to stop applying exclusionary discipline to students of color, students with disabilities, students who identify not the gender spectrum, and all others unless absolutely necessary.
How we interpret data on social disparities, particularly those that cause harm to children, is subject to our own biases. The sooner we recognize that, the sooner we can get down to business and actually attack the problem through application of scientific principles.
- The data shown in this chart has been slightly modified from the available official data I could find online for the 2011-2012 SY. Minnesota tracks only by biological gender, and the official tally was 72% boys vs. 28% girls. In an effort to ensure inclusion of gender-expansive students, II found an unverified report that students identifying as part of the gender expansive / LGBTQ+ community were twice as likely to be subjected to exclusionary discipline. So I guesstimated that population to be 5% of the total, doubled the disciplinary number to 10% based on the report, and then split it proportionally between children identifying as male vs. children identifying as female. The intent of creating this chart was not for it to be exact, but rather to demonstrate the point of how we, as humans, interpret data, particularly confirming data, through the lens of our inherent biases. I welcome any more current and expansive data on this particular demographic. ↩︎
- The original report cited here stated 39 schools districts and charter schools, but it was subsequent noted in 2022 that it was a total of 41. ↩︎


Leave a comment