In August 2018, the Minnesota Department of Human Rights (MDHR) announced that it had entered into settlement or tentative agreements with 39 charter schools or school districts “to reduce disparities in suspensions and expulsions for students with disabilities and students of color for non-safety related incidents.” [Source, emphasis added]. Hopkins Public Schools was one of the 39 three year agreements ending in 2021. According to a June 2022 Suspensions and Expulsions Report from MDHR, for the 2015-16 school year in Minnesota (not specifically Hopkins 270) “Black students were 8 times more likely to be suspended or expelled than white students.” [MDHR 2022 Report]
I learned of this settlement while watching the Dec 20, 2022 School Board Workshop session [YouTube], in which the Board received a “Restorative Practices” update from Maria Béarre-Bóynne, the Restorative Practices Coordinator for Hopkins 270. Béarre-Bóynne stated in her presentation that the 2018 agreement with MDHR provided for Hopkins to address these disparities [in suspensions and expulsions by race] through the implementation of restorative culture practices district wide.
I have tried to find the 2018 MDHR – Hopkins Public Schools Agreement to read the language, but have been unsuccessful in locating it online [if anyone reading this has a copy, please let me know]. Nonetheless, we do have the MDHR 2022 Report that was referenced by Béarre-Bóynne in her presentation.
Brief Reminder of Correlation vs. Causation
For those that may not recall the difference, I’ll start with a bit of a primer on correlation vs. causation.
Starting with the latter, CAUSATION examines the relationship between variables where we can establish that one causes the other to occur. For example, the gravitation of the moon and high tides: science as determined that the gravity of the moon as it orbits has a causal effect on large bodies of water resulting in high tides.
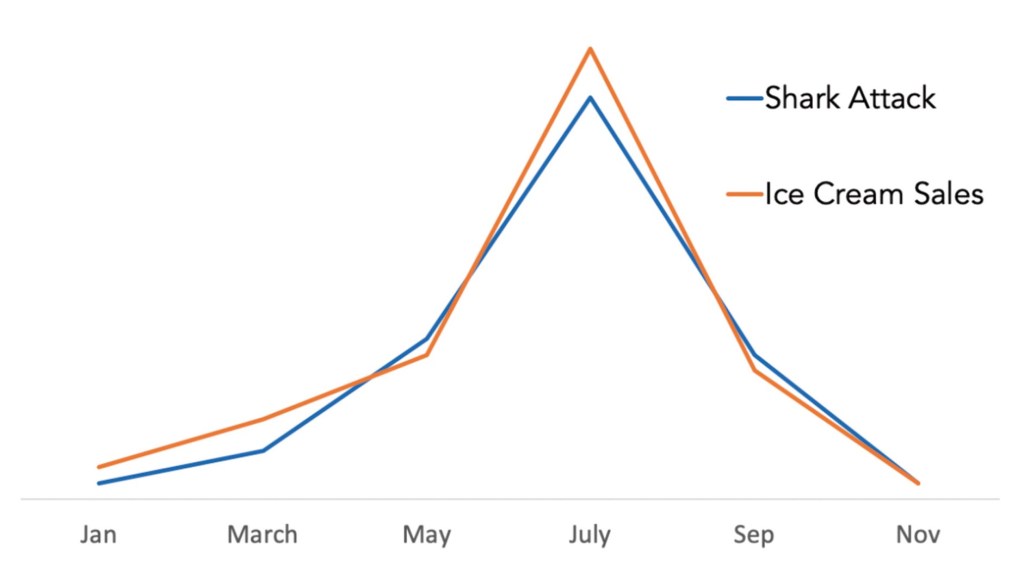
CORRELATION, on the other hand, looks at the relationship between two or more variables, but without establishing cause and effect. Two variables that are positively correlated are likely to occur or move together, while variables that are negatively correlated are likely to occur or move in opposite. Here is a common example of correlation:
Scientific Methods, Not Feelings, Establish Causation
We can all agree that we want to prevent shark attacks. Fortunately, few people will see the above chart and try to argue that we will prevent shark attacks by banning the sale of ice cream each summer. Why? Because anyone with any degree of common sense (which may not be so common these days) knows that ice cream sales do not cause shark attacks and that a rise in shark attacks during the summer months isn’t what makes people want to buy more ice cream. That is, experience tells us that the relationship between shark attacks and ice cream consumption from May to September are highly correlated, but not causal, and we do not need to apply scientific testing to validate our conclusions.
Nonetheless, people see the following infographic from the 2022 MDHR Report and without any additional facts jump to the conclusion that there is a causal relationship between 1) racial bias and animus, and 2) the disparity of black student expulsions and suspensions to white student expulsions and suspension in Minnesota.
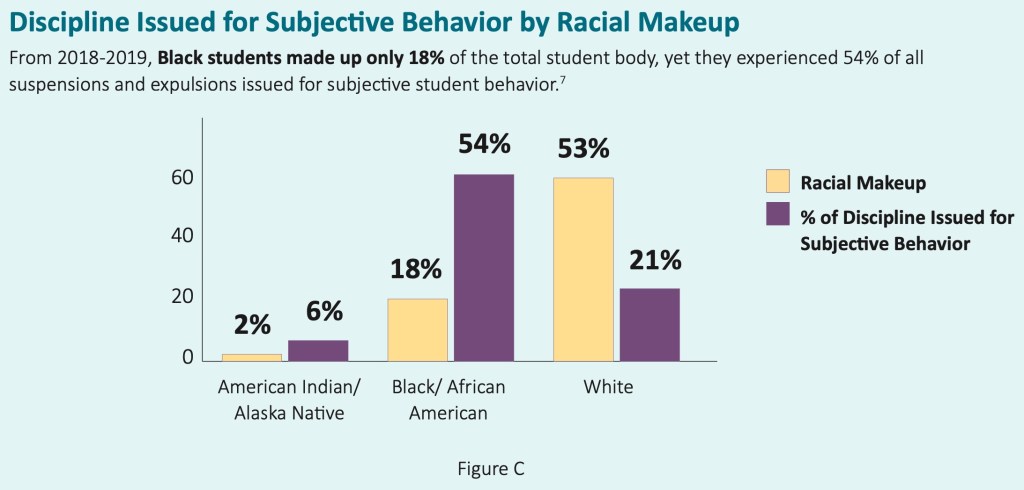
Why do people presume a causal connection based solely on the above infographic?
Science demonstrates that humans are evolutionarily prone to seeing recognizable patterns [NIH]. It truly is our nature, deeply engrained in our flight or fight level survival instinct. It kept our ancestors alive on the savannah. Accordingly, those of us programmed to be looking for evidence of X as part of a pattern, are more likely to see a new fact or statistic (a signal) that aligns with our vision as confirming the anticipated pattern. That is a natural emotional response. We often call it a “gut instinct.”
The thing is that we are not on the savannah anymore. Instead, we have science and established methodologies to examine the data to determine if it is part of the pattern and causal, or if it is not part of the pattern and is merely correlative. We can do so without relying on our “gut instinct” and instead use scientific methods to determine if the above chart reflects a causal relationship between acts of racism in our schools, including Hopkins 270, and disparities between black and white students in exclusionary discipline.
In my next post, I examine how this applies to the MDHR Report and Hopkins 270’s response of implementing and maintaining so-called Restorative Practices.


Leave a comment